Data Analytics
Technology
Data Analytics
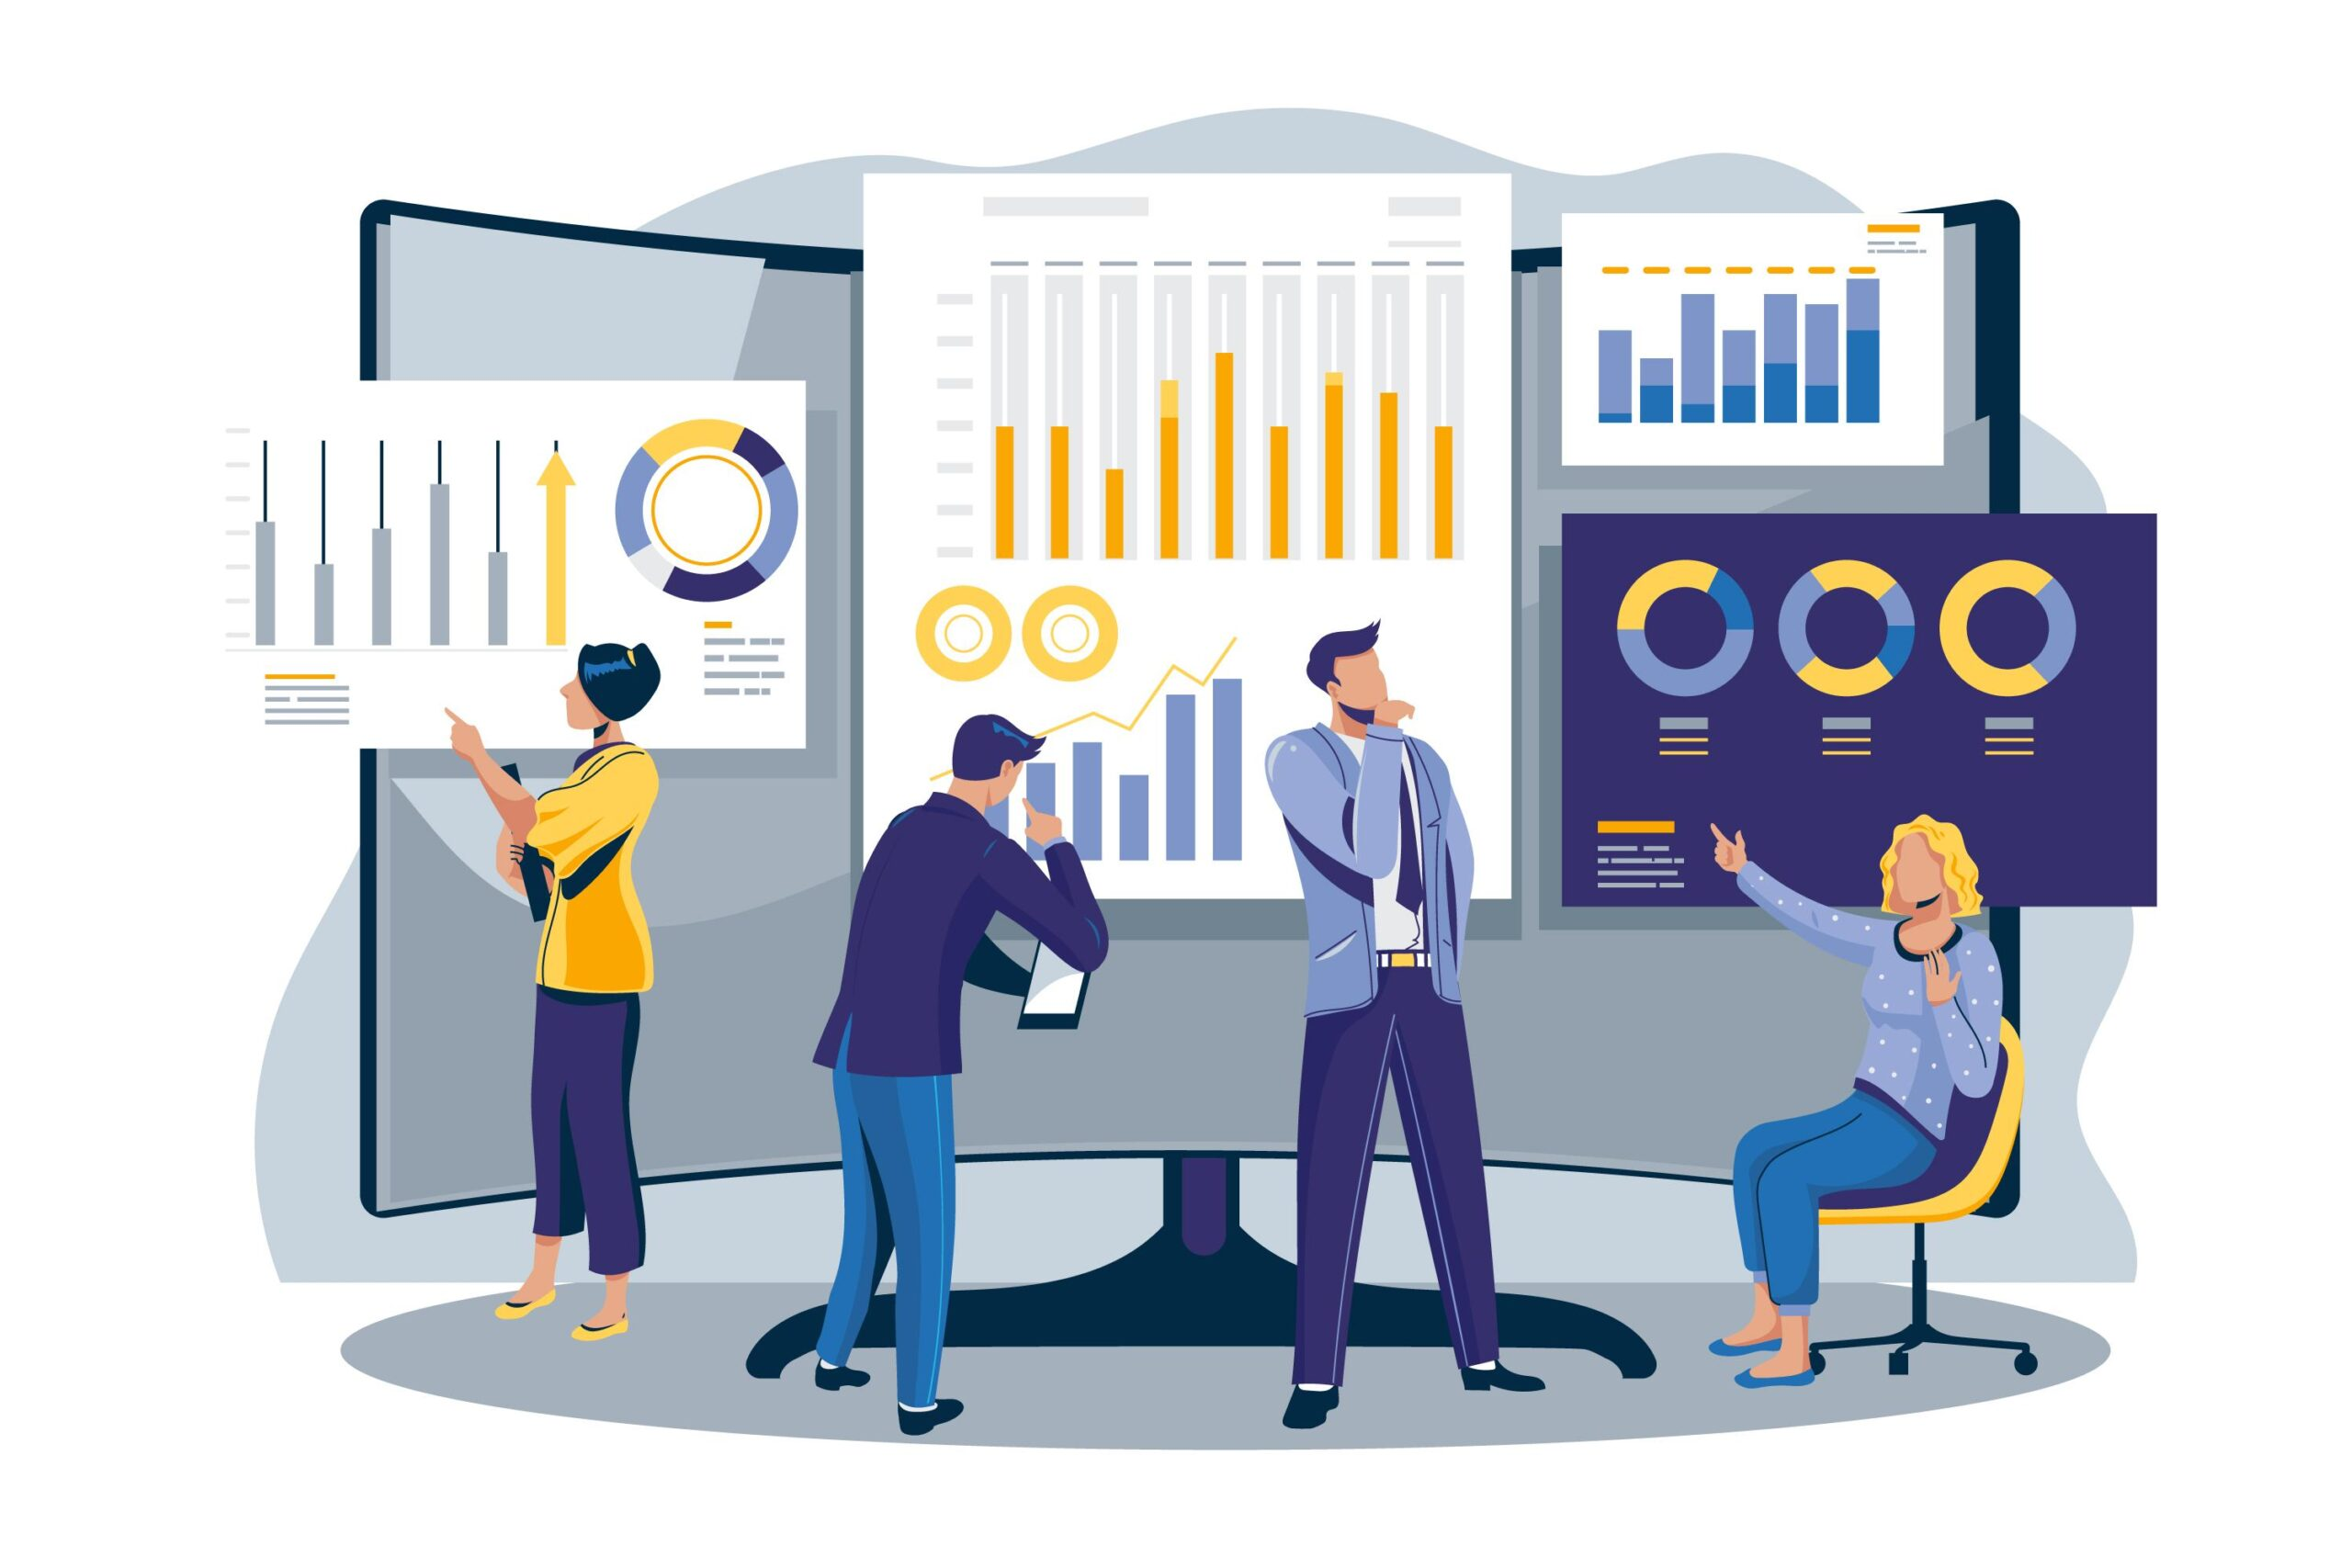
Statistical Storyboard
Architecture Planning—the blueprint for your data cathedral. It's where you decide whether your data will soar like a Gothic spire or flow like a minimalist fountain. Architects balance scalability, security, and elegance, creating a cathedral where data worshippers find solace.
Python Dash, the engineer's canvas — where pure Python becomes a live, interactive dashboard without writing a line of JavaScript. Built on top of Plotly, Dash turns data science scripts into production-grade analytical apps, complete with callbacks, real-time updates, and drill-down filters. It's the tool of choice when you need a bespoke, data-heavy UI that no BI tool can replicate.
Microsoft Power BI, the maestro of visual storytelling, orchestrates data into vibrant dashboards and reports. It's like a kaleidoscope for your business metrics, revealing patterns, trends, and outliers. With Power BI, you're not just crunching numbers; you're composing a data symphony that resonates with decision-makers.
Google Looker Studio, on the other hand, is the avant-garde painter. It blends data exploration with aesthetics, creating interactive canvases where dimensions and measures blend seamlessly. Imagine Picasso meets SQL—Looker Studio lets you brush strokes of queries, filters, and dimensions onto your canvas, revealing hidden insights like colors emerging from a palette.
Superset, the data alchemist, transmutes raw data into gold. It's an open-source sorcerer that conjures up interactive visualizations, slicing and dicing data like a master chef. With Superset, you're not just querying; you're summoning insights, turning mundane spreadsheets into magical dashboards.
And then there's the backstage magic—the Data Pipelines and ETL (Extract, Transform, Load) wizards. They're like stagehands, ensuring data flows smoothly from source to spotlight. Data pipelines weave together disparate datasets, while ETL scripts transform them into harmonious formats. Think of them as the unsung heroes—the ones who make sure the show goes on.
So, dear data virtuoso, wield these tools with finesse. Let your portfolio resonate with the rhythm of data, and may your analytics symphony echo across the digital landscape. 📊📊✨
Infrastructure as Code — AWS CDK
Cloud-Scale Analytics Architecture
These aren't just tools listed on a resume — the entire analytics stack is provisioned and version-controlled via AWS CDK, deployable identically across dev, staging, and production with zero drift. From raw ingestion to served insights, every layer is code.
AWS Glue handles CDK-provisioned ETL jobs that ingest raw sources into the data lake, while Amazon Athena powers serverless SQL directly over S3 for instant ad-hoc analytics. AWS Lambda functions act as lightweight event-driven processors — triggering transformations, routing data between services, and gluing the pipeline stages together without managing a single server. Amazon Spark handles terabyte-scale batch transformations, and Amazon MSK (Kafka) paired with Apache Flink drives real-time streaming analytics pipelines that process events the moment they arrive. AWS Step Functions orchestrates the entire multi-stage ETL workflow end-to-end, with retries, branching, and observability baked in.
Analytics That Win Work
From Dashboards to Decisions
Power BI was new to me when a taxi-booking client wanted to see what their data could do. I taught myself the tool, worked across teams, and built a demo of 20+ analytical reports against a tight deadline. The session was booked for 30 minutes — it ran 2.5 hours and won the project.
That analytics track became the foundation for what I lead on the same platform today: demand forecasting and hotspot intelligence by zone and hour, and an admin GenBI chatbot on WrenAI that lets the team ask plain-English questions over the full dataset instead of waiting on an analyst.
Data Analytics Focus Areas
- Taxi Apps like Ola/Uber
- E-commerce
- Online Ordering System like Swiggy
- POS & Inventory Management System