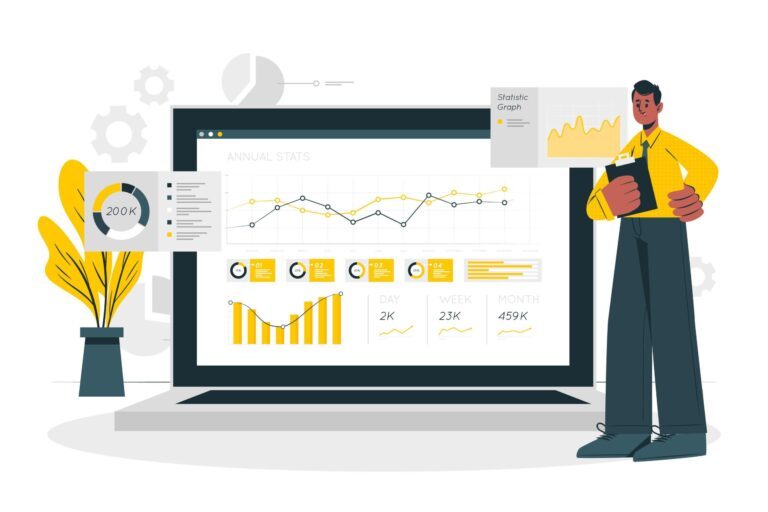

Statistical Storyboard
Architecture Planning—the blueprint for your data cathedral. It’s where you decide whether your data will soar like a Gothic spire or flow like a minimalist fountain. Architects balance scalability, security, and elegance, creating a cathedral where data worshippers find solace.
Microsoft Power BI, the maestro of visual storytelling, orchestrates data into vibrant dashboards and reports. It’s like a kaleidoscope for your business metrics, revealing patterns, trends, and outliers. With Power BI, you’re not just crunching numbers; you’re composing a data symphony that resonates with decision-makers.
Google Looker Studio, on the other hand, is the avant-garde painter. It blends data exploration with aesthetics, creating interactive canvases where dimensions and measures blend seamlessly. Imagine Picasso meets SQL—Looker Studio lets you brush strokes of queries, filters, and dimensions onto your canvas, revealing hidden insights like colors emerging from a palette.
Superset, the data alchemist, transmutes raw data into gold. It’s an open-source sorcerer that conjures up interactive visualizations, slicing and dicing data like a master chef. With Superset, you’re not just querying; you’re summoning insights, turning mundane spreadsheets into magical dashboards.
And then there’s the backstage magic—the Data Pipelines and ETL (Extract, Transform, Load) wizards. They’re like stagehands, ensuring data flows smoothly from source to spotlight. Data pipelines weave together disparate datasets, while ETL scripts transform them into harmonious formats. Think of them as the unsung heroes—the ones who make sure the show goes on.
So, dear data virtuoso, wield these tools with finesse. Let your portfolio resonate with the rhythm of data, and may your analytics symphony echo across the digital landscape. 🎨📊✨
Data Analytics Focus Areas


